Where would you like to live?
Start with your priorities and discover which areas are worth comparing.
Find my area doveabi.to
Compare areas in Italy by home prices, air quality and green spaces. Your results change with what matters to you.
Experimental project: results use simulated metrics. Sources
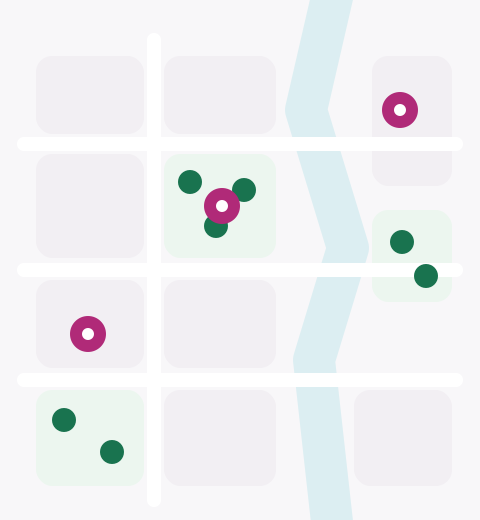
An affordable area may be far from green spaces.
A greener area may cost more.
An affordable area may have different air quality.
doveabi.to brings these factors together on one map, so you can compare trade-offs and choose according to your priorities.
PRICE, GREEN SPACES AND AIR
Three factors to consider together, to understand which areas are worth a closer look.
Illustrative preview: the value shown is a demonstration, not a result for a real area.
How much does it cost to live here?
How much green space is around you?
What is the air quality like in the area?
Give more importance to price, green spaces or air quality. Changing your priorities can change the suggested areas. Start the guided search and explore the trade-offs.
Set your budget and, if you wish, the floor area you are looking for.
Your total budget can only be assessed if you also enter a floor area. Without it, you can compare areas but cannot check whether they fit your budget. The estimate is not the price of a property for sale.
HOW IT WORKS
Open the guide, choose a geographic area and set your budget and priorities. Floor area is optional.
Explore suggestions and compare benefits and trade-offs based on what matters to you.
Explore the local context, check the indicators and review the coverage and sources of available data.
This project is in development: ranking metrics for air quality, prices and greenery are still simulated, not an official ranking. Observed park and service data are only available in pilot areas and remain separate from the score.
Experimental ranking metrics are separate from the territorial boundaries and observed data available. ISTAT boundaries and OpenStreetMap parks and services in pilot areas do not make the prices or air quality values used in the ranking real.
Explore sources and methodologyStart with your priorities and discover which areas are worth comparing.
Find my areaON YOUR PHONE TOO
Scan the QR code with your phone camera to start the guided search in your browser. No app installation needed.
 Start the guide on your phone